
TV viewing has never offered audiences more choice. But for the industry trying to understand those audiences, that choice creates an increasingly complex measurement challenge.
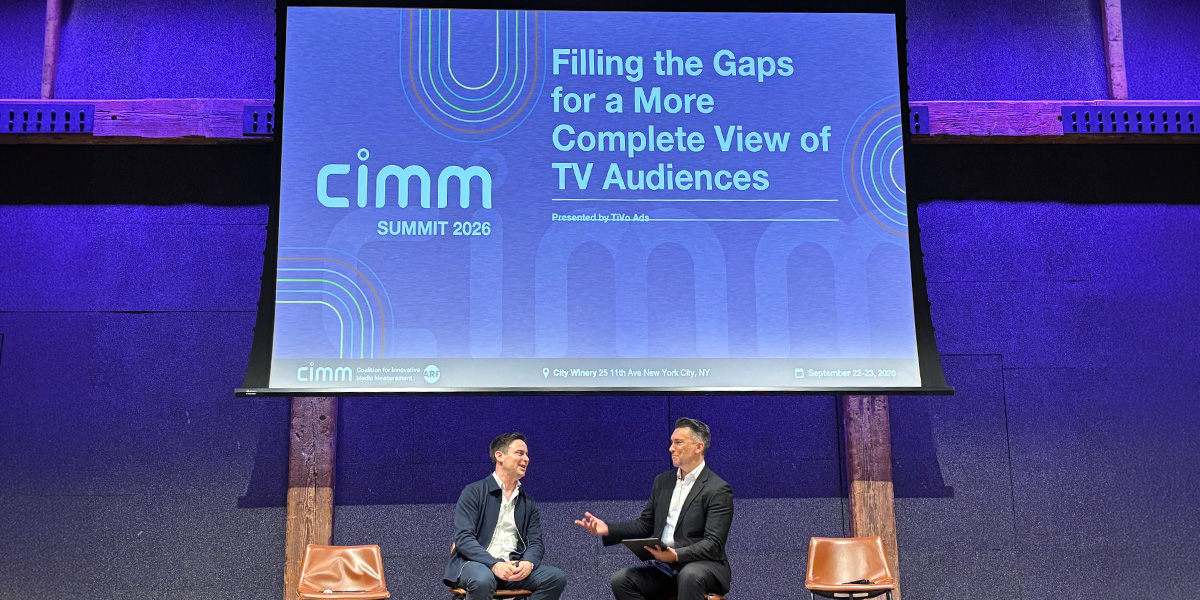
At CIMM Summit XV in New York, JP O’Keeffe, Director, Data Product Management at TiVo Ads, joined Jon Watts, Managing Director at CIMM, for a conversation on Filling the Gaps for a More Complete View of TV Audiences. The discussion explored one of the fundamental challenges facing TV today: As viewing fragments across more platforms, devices, and delivery paths, how do we build a more complete understanding of what audiences are actually watching? And, just as importantly, are we asking the right questions about the data being used to build that picture?
Here are some of the key themes from the conversation.
Fragmentation is creating new gaps in the picture
The way people watch TV has changed dramatically. A single program can now be consumed through over-the-air broadcast, pay TV, a broadcaster’s streaming app, FAST services, virtual MVPDs, and other connected platforms and devices. The challenge is that there is no single system tracking every one of those delivery paths.
Fragmentation isn’t simply about audiences moving between linear and streaming. It is about an increasingly complex combination of platforms, devices, and distribution environments — each creating different signals and potential gaps in our view of the audience. That makes understanding the strengths and limitations of the underlying data increasingly important.
There is no single perfect viewership data source
The industry is well aware that there is no census-level dataset that comprehensively captures every form of television viewing. Different sources see different parts of the viewing landscape.
Set-top box data, for example, can provide a deeper view of local linear television. But limited with viewership of streaming.
Automatic content recognition (ACR) data provides another perspective, helping capture viewing taking place on CTV and, depending on the environment, activity associated with connected devices and streaming.
Neither source tells the whole story on its own.
That is why complementary data sources can be so valuable. Bringing different signals together can help address some of the gaps created by an increasingly fragmented viewing landscape. But combining data is only part of the challenge.
Scale alone doesn’t tell you the quality of the data
In a market where datasets are frequently discussed in terms of millions of devices or households, it can be tempting to treat scale as the primary measure of value.
Behind any large viewership dataset is significant work around cleaning, identifying anomalies, combining and deduplicating data, calibration, and determining how different signals should be interpreted. There are also methodological decisions throughout that process.
Even two organizations working with similar technology and similar device footprints could ultimately produce different outputs because of the decisions they make about areas such as fingerprinting, identity, coverage, and processing.
In other words, buyers shouldn’t simply evaluate the size of a dataset. Transparency around how that dataset was built, what it captures, what it misses, and how those gaps are addressed is equally important. That means asking the right questions about the data and methodology behind the headline numbers.
Ask where the data goes quiet
Perhaps one of the most important questions raised during the session was also one of the simplest: Where does the data go quiet?
Every source has areas it does not observe. With ACR, for example, there can be differences between opted-in and opted-out populations, limitations around native CTV applications, and differences in the content that can be identified.
Other signals may be observed without providing enough information to confidently determine exactly where that viewing originated.
Those gaps become particularly important when viewership data is being used for measurement and the observed data is being weighted, scaled, or projected to represent a broader population. Understanding what isn’t visible can therefore be just as important as understanding what is.
Transparency should be part of the buying conversation
For buyers, the questions around TV data need to go beyond: How big is your dataset?
The more useful questions are:
- What’s your match rate, national versus local?
- Where does unmatched viewing go: is it held back or redistributed?
- What do you calibrate against, and how do you combine sources?
- What can’t you get access to, and why?
- What is being modeled?
- And where are the gaps?
There may not be a single dataset capable of observing every moment of television viewing. But the industry can be much clearer about what its data represents, how it is constructed, and where its limitations lie.
Building a more complete view of TV
As audiences continue to move across linear television, streaming, FAST, and connected environments, measurement will inevitably become more complex. The answer isn’t simply more data. It is about bringing together complementary signals, understanding the strengths and limitations of each, asking the right questions, and demanding greater transparency around the methodology used to turn those signals into meaningful insights. Because in a fragmented TV landscape, getting closer to the full picture starts with understanding what is — and isn’t — in the data.

Comments are closed.