

Entertainment platforms, devices and portals continue to evolve at a dizzying pace; where content consumption is headed next, no one knows … or do we?
TiVo has conducted a quarterly consumer habits survey since 2012. Our latest Q4 2016 Video Trends Report uncovered many unexpected results and potentially predictive behaviors from a survey from more than 3,100 participants. Some surprising revelations include respondents’ ideal price per channel in an á la carte pay-TV environment, possible reasons for declining National Football League (NFL) viewership, the correlation between streaming devices and cord cutting, and so much more.
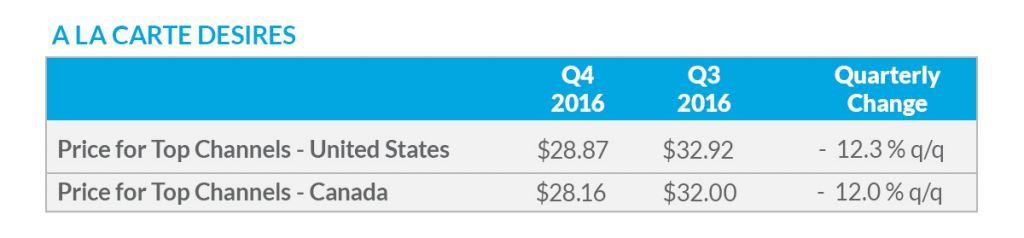
How much will consumers pay for their favorite 20 channels?
The Q4 2016 Video Trends Report reveals not only the most desired à la carte channels, but also how much respondents in the U.S. and Canada would like to pay for each channel. The ideal price respondents would pay for the top 20 channels dropped dramatically from last quarter, decreasing 12.3% among U.S. respondents and 12.0% among Canadian respondents.
With so many video content options now available to consumers, is linear TV’s value dwindling due to increasing choices?
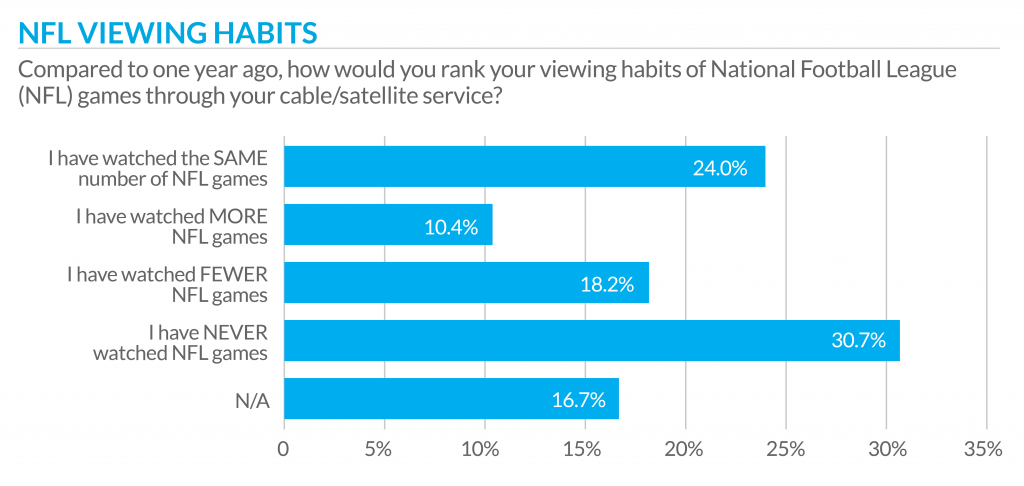
Respondents’ sentiments toward the NFL are taking a hit
The 2016 – 2017 NFL season had many storylines, one of which was lower ratings. TiVo wanted to determine if respondents were watching fewer NFL games (they were) and why. Survey results showed that 18.2% of respondents watched fewer NFL games than the previous year. But, what prompted this decline?
While the top three answers were no surprise (36.1% – “my schedule is busier this year;” 25.9% – “games are not as exciting this season;” 21.3% – “too many commercials”), 23.0% answered “other.” TiVo dug deeper to learn 46.5% of the “other” respondents revealed they changed their NFL viewing habits because of political issues. If instead of “other,” the survey had listed an answer choice such as “politics related to teams/players,” 10.7% of total respondents would have selected that answer.
Cutting cords mid-stream?
As the popularity of streaming devices rises and enables access to over-the-top (OTT) services via video apps, TiVo aims to measure this viewing evolution and its effect on future cable cutting. Therefore, TiVo’s Data Science Team analyzed the survey results to delve deeper into two scenarios:
- Whether respondents with pay-TV service and a streaming device are more likely to cut their cable and/or switch to an online app or OTT service.
- Whether streaming device owners who replaced a pay-TV provider’s set-top box (STB) are more likely to cut cable and/or switch to an online app or OTT service. For example, instead of paying for the STB in the master bedroom, a homeowner uses a Roku device to watch live TV via the Time Warner Cable app.
See pages 30-31 of the report to read what TiVo’s analytics team discovered.
With this long-running survey, TiVo continues our quest to understand quarter-over-quarter and year-over-year trends across pay-TV, video on demand, pay-per-view, TV Everywhere, OTT, TV network apps, connected devices and content discovery. After all, to truly stay ahead of the curve, one needs a clear view of the road ahead.
© 2017 TiVo Corporation. All Rights Reserved. TiVo and the TiVo logo are registered trademarks of TiVo Corporation and its subsidiaries worldwide.
Comments are closed.